 SpanDraft
Safety factor and assessment limits
What the safety factor compares
The bending stress describes the stress state, the material provides a comparison value. SpanDraft relates the two:
Here stands for the strength value stored in the material: the yield strength or the 0.2 % proof strength . The material data set states explicitly which one applies, and the report shows the formula with the respective symbol. Influences such as component thickness or temperature must already be taken into account when choosing the strength value, as the chapter Material properties describes. SpanDraft uses no further factors.
What states depends on the strength value. For materials with a pronounced transition, marks the onset of yielding. is the stress on the stress–strain curve of the material at which a permanent strain of 0.2 % is present. In both cases, states only that the calculated stress reaches this value. SpanDraft does not calculate permanent strains in the component.
| Value | Meaning in the model |
|---|---|
| The calculated bending stress is below the strength value. | |
| The elastically calculated governing extreme fiber stress reaches the strength value. | |
| The elastically calculated stress is above the strength value. | |
| The bending stress is zero. This does not mean “infinitely safe”. |
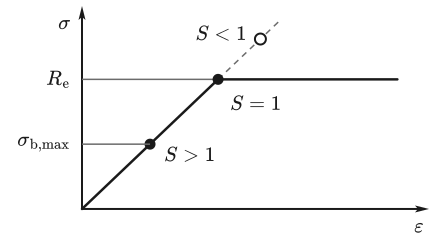
For , the strength value is exceeded. then remains a calculated value from the linear-elastic assumption and cannot readily be read as the actual stress in the material. SpanDraft continues calculating on the dashed straight line in Figure 1; the material curve does not follow it. For , a different curve shape applies, as shown in the chapter Material properties.
Which input changes what
The chain from load to safety factor can be read off a calculation run. The starting point is the example from the chapter Bending stress and extreme fibers: single-span beam, , at 1.2 m, T-section, S235JR. Each row changes exactly one input; and are changed separately for this purpose as manual cross-section values.
| Change | in mm | in Nm | in MPa | |
|---|---|---|---|---|
| Baseline case | 3.677 | 1092 | 43.26 | 5.432 |
| Load · 2 | 7.354 | 2184 | 86.53 | 2.716 |
| 11.19 | 1092 | 43.26 | 5.432 | |
| 1.839 | 1092 | 43.26 | 5.432 | |
| 3.677 | 1092 | 21.63 | 10.86 | |
| 3.677 | 1092 | 43.26 | 8.205 | |
| AlMgSi0,5 T66 | 11.19 | 1092 | 43.26 | 3.467 |
Three statements can be read from this:
- Stiffness and strength are separate. and change the deflection but not the stress. A stiffer material does not increase .
- The moment curve here does not depend on and . SpanDraft uses a constant and over the beam. A change of or therefore scales equally everywhere. For unchanged loads, geometry and support conditions, support reactions and moment curve remain the same, only displacements and rotations change. This also holds in a statically indeterminate system, for example a continuous beam over three supports.
- A large says nothing about the deformation. The last row uses an aluminum alloy from the material library: remains clearly above 1 at 3.467, but the deflection is about three times as large.
For real sections, and change together, since both come from the same geometry. If self-weight is enabled, area and density additionally influence the load.
S as a load factor
In the linear model, internal forces and moments and stresses are proportional to the loads. If all loads are scaled by the same factor , the bending stress changes by the same factor. If it is different from zero, it reaches the strength value exactly at :
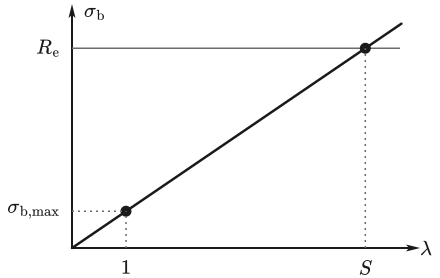
Figure 2 shows this for the example with . A SpanDraft calculation run with yields there.
This reading presupposes that all loads are scaled by the same factor. If a portion such as the self-weight is not scaled along, a different factor applies. For , means an increase of the loads, for a decrease. For , there is no such factor. The statement concerns only the bending stress.
What S = 1 means
initially means only that the elastically calculated governing extreme fiber stress reaches the stored strength value. It does not follow in general that the component fails exactly at this point or that its load-bearing capacity is exhausted.
A deliberately idealized counterexample is a rectangular cross-section made of an elastic–perfectly plastic material. Elastically, holds. In the fully plastic state, the stress acts on each half of the cross-section. Each half yields the resultant , which acts at the centroid of its half at ±. The distance between the two resultants is :1
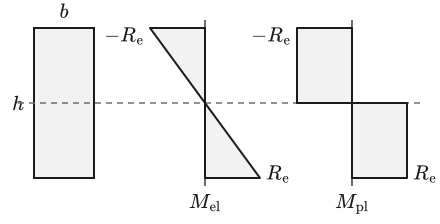
SpanDraft does not take this plastic reserve into account and uses exclusively the elastic . Conversely, means only that the calculated elastic bending stress is below the strength value. It says nothing about stability or fatigue.
What the assessment does not cover
compares exactly one stress with exactly one strength value. The following effects lie outside this evaluation. They are not decisive in every case but must be considered separately depending on the component.
| Effect | Why it can change the statement |
|---|---|
| Shear and equivalent stress | Shear force produces shear stresses. Where they coincide with a large bending stress, the equivalent stress is higher than the bending stress there.2,3 |
| Axial force | A real axial force superposes as with the bending stress. The model contains no user-defined axial loads. |
| Stability | Compressed regions can buckle before the strength value is reached. Thin-walled open sections are sensitive to lateral-torsional buckling because of their low torsional stiffness, and the critical load also depends on the lateral support.4 |
| Fatigue | Repeated loads can accumulate damage even far below the yield strength. A single static stress calculation does not show this.5 |
| Notches and local details | Holes, shoulders and other geometric discontinuities produce local stress peaks that beam theory does not contain.6 SpanDraft does not assess welds either. |
| Deformation | No allowable deflection is stored. is reported but not assessed. |
| Normative design | Standards define their own actions, factors and verification formats. is neither such a code check nor an approval. |
Analytical
A more comprehensive static stress assessment takes further stress components into account and an equivalent or interaction criterion that matches the material and the verification. Stability, fatigue and local details are verification types of their own.
SpanDraft
SpanDraft evaluates exclusively the elastic bending stress. The calculated shear force is available in the results but does not enter or .
Deep dive: example on shear stress
The example shows only one thing: takes no shear stress into account. It is no SpanDraft evaluation and no complete assessment of a short beam; shear and equivalent stress are hand calculations.
For a rectangular cross-section and a point force at midspan, holds, so 2.5 % for . In slender beams, shear is therefore usually of secondary importance.2 For T and I sections, the transition from web to flange deserves particular attention, because both stresses can occur there clearly at the same time.2
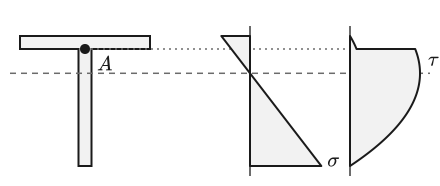
At point , both stresses occur at the same time. At this point, the shear stress and the von Mises equivalent stress can be determined by hand:2,3
Here is the first moment of area of the partial cross-section above the location under consideration and the width there. The table compares the example beam with a beam ten times shorter under ten times the force. Both are statically determinate, so and follow from equilibrium alone: the largest moment remains the same, the shear force becomes ten times as large. The evaluated location is to the left of the force, with at point , and .
| Quantity | ||
|---|---|---|
| (SpanDraft) | 5.432 | 5.432 |
| in N (SpanDraft) | 910 | 9100 |
| at in MPa (hand calculation) | 1.197 | 11.97 |
| at in MPa (hand calculation) | 11.52 | 23.63 |
remains the same although shear stress and equivalent stress at point change markedly. The short beam with also lies in a range in which the shear deformation neglected in the Euler–Bernoulli model is no longer readily small. Here this concerns the deflection, not and .
Display in application and report
Application and report show , , and . For deflection and moment, the report additionally gives the location and, if applicable, the side. The corresponding operation is described in the help under Bending stress and safety factor.
Calculation is always done with unrounded values. Rounding is applied only for display, by default to three significant digits. The safety factor is never rounded up: a value below 1 never appears as 1, for example 0.9995 as 0.999. A displayed 1, on the other hand, can also stand for 1.004. For this range, the number of digits can be increased in the settings; the calculation does not change as a result.
Deep dive: edge cases of the evaluation
If the bending stress is exactly zero, SpanDraft explicitly returns , without dividing by zero. NaN does not arise in the evaluation. Small stresses are not artificially set to zero, so there is no zero threshold.
In addition, the limits of floating-point numbers apply: if the division for overflows, also results. If the stress division underflows, the stress can become zero. A stress that is no longer representable is rejected and not output as an infinite value.
Sources
- Laboratory Module 3: Sheet metal forming: elastic-plastic beam bending. 2.002 Mechanics and Materials II, Massachusetts Institute of Technology / MIT OpenCourseWare. 2004. Accessed .
- David Roylance. Stresses in Beams. Mechanics of Materials, Massachusetts Institute of Technology / MIT OpenCourseWare. 2000. Accessed .
- David Roylance. Yield and Plastic Flow. Mechanics of Materials, Massachusetts Institute of Technology / MIT OpenCourseWare. Accessed .
- Rafał Piotrowski; Andrzej Szychowski. Evaluation of the Influence of Bolt Fastener Spacing on the Elastic Critical Load from the Lateral-Torsional Buckling Condition of Built-Up Bending Members. Materials 17 (14), 3392. 2024. DOI 10.3390/ma17143392. Accessed .
- David Roylance. Fatigue. Mechanics of Materials, Massachusetts Institute of Technology. 2001. Accessed .
- David Roylance. Closed-Form Solutions. Mechanics of Materials, section Stresses around a circular hole, Massachusetts Institute of Technology via Engineering LibreTexts. Accessed .